Comparison
evaluate_comparison(pred_list, labels, out_path, model_names=None, class_names=None, multi_label=False, metrics_threshold=0.5, macro_average_classes=False, suffix=None)
¤
Function for performance comparison evaluation based on predictions from multiple models.
Example
# Import libraries
from aucmedi import *
from aucmedi.evaluation import *
from aucmedi.ensemble import *

# Load data
ds = input_interface(interface="csv",                       # Interface type
                     path_imagedir="dataset/images/",
                     path_data="dataset/annotations.csv",
                     ohe=False, col_sample="ID", col_class="diagnosis")
(samples, class_ohe, nclasses, class_names, image_format) = ds

# Initialize model
model_a = NeuralNetwork(n_labels=8, channels=3, architecture="2D.ResNet50")

# Initialize Bagging object for 3-fold cross-validation
el = Bagging(model_a, k_fold=3)

# Do some predictions via Bagging (return also all prediction ensembles)
datagen_test = DataGenerator(samples, "dataset/images/", labels=None,
                             resize=model.meta_input, standardize_mode=model.meta_standardize)
pred_merged, pred_ensemble = el.predict(datagen_test, return_ensemble=True)

# Pass prediction ensemble to evaluation function
evaluate_comparison(pred_ensemble, class_ohe, out_path="./", class_names=class_names)


# Do some predictions with manually initialized models
model_b = NeuralNetwork(n_labels=8, channels=3, architecture="2D.DenseNet121")
model_c = NeuralNetwork(n_labels=8, channels=3, architecture="2D.MobileNetV2")

pred_a = model_a.predict(datagen_test)
pred_b = model_b.predict(datagen_test)
pred_c = model_c.predict(datagen_test)

pred_ensemble = [pred_a, pred_b, pred_c]

# Pass prediction ensemble to evaluation function
evaluate_comparison(pred_ensemble, class_ohe, out_path="./", class_names=class_names)
Created files in directory of out_path:
- "plot.comparison.beside.png"
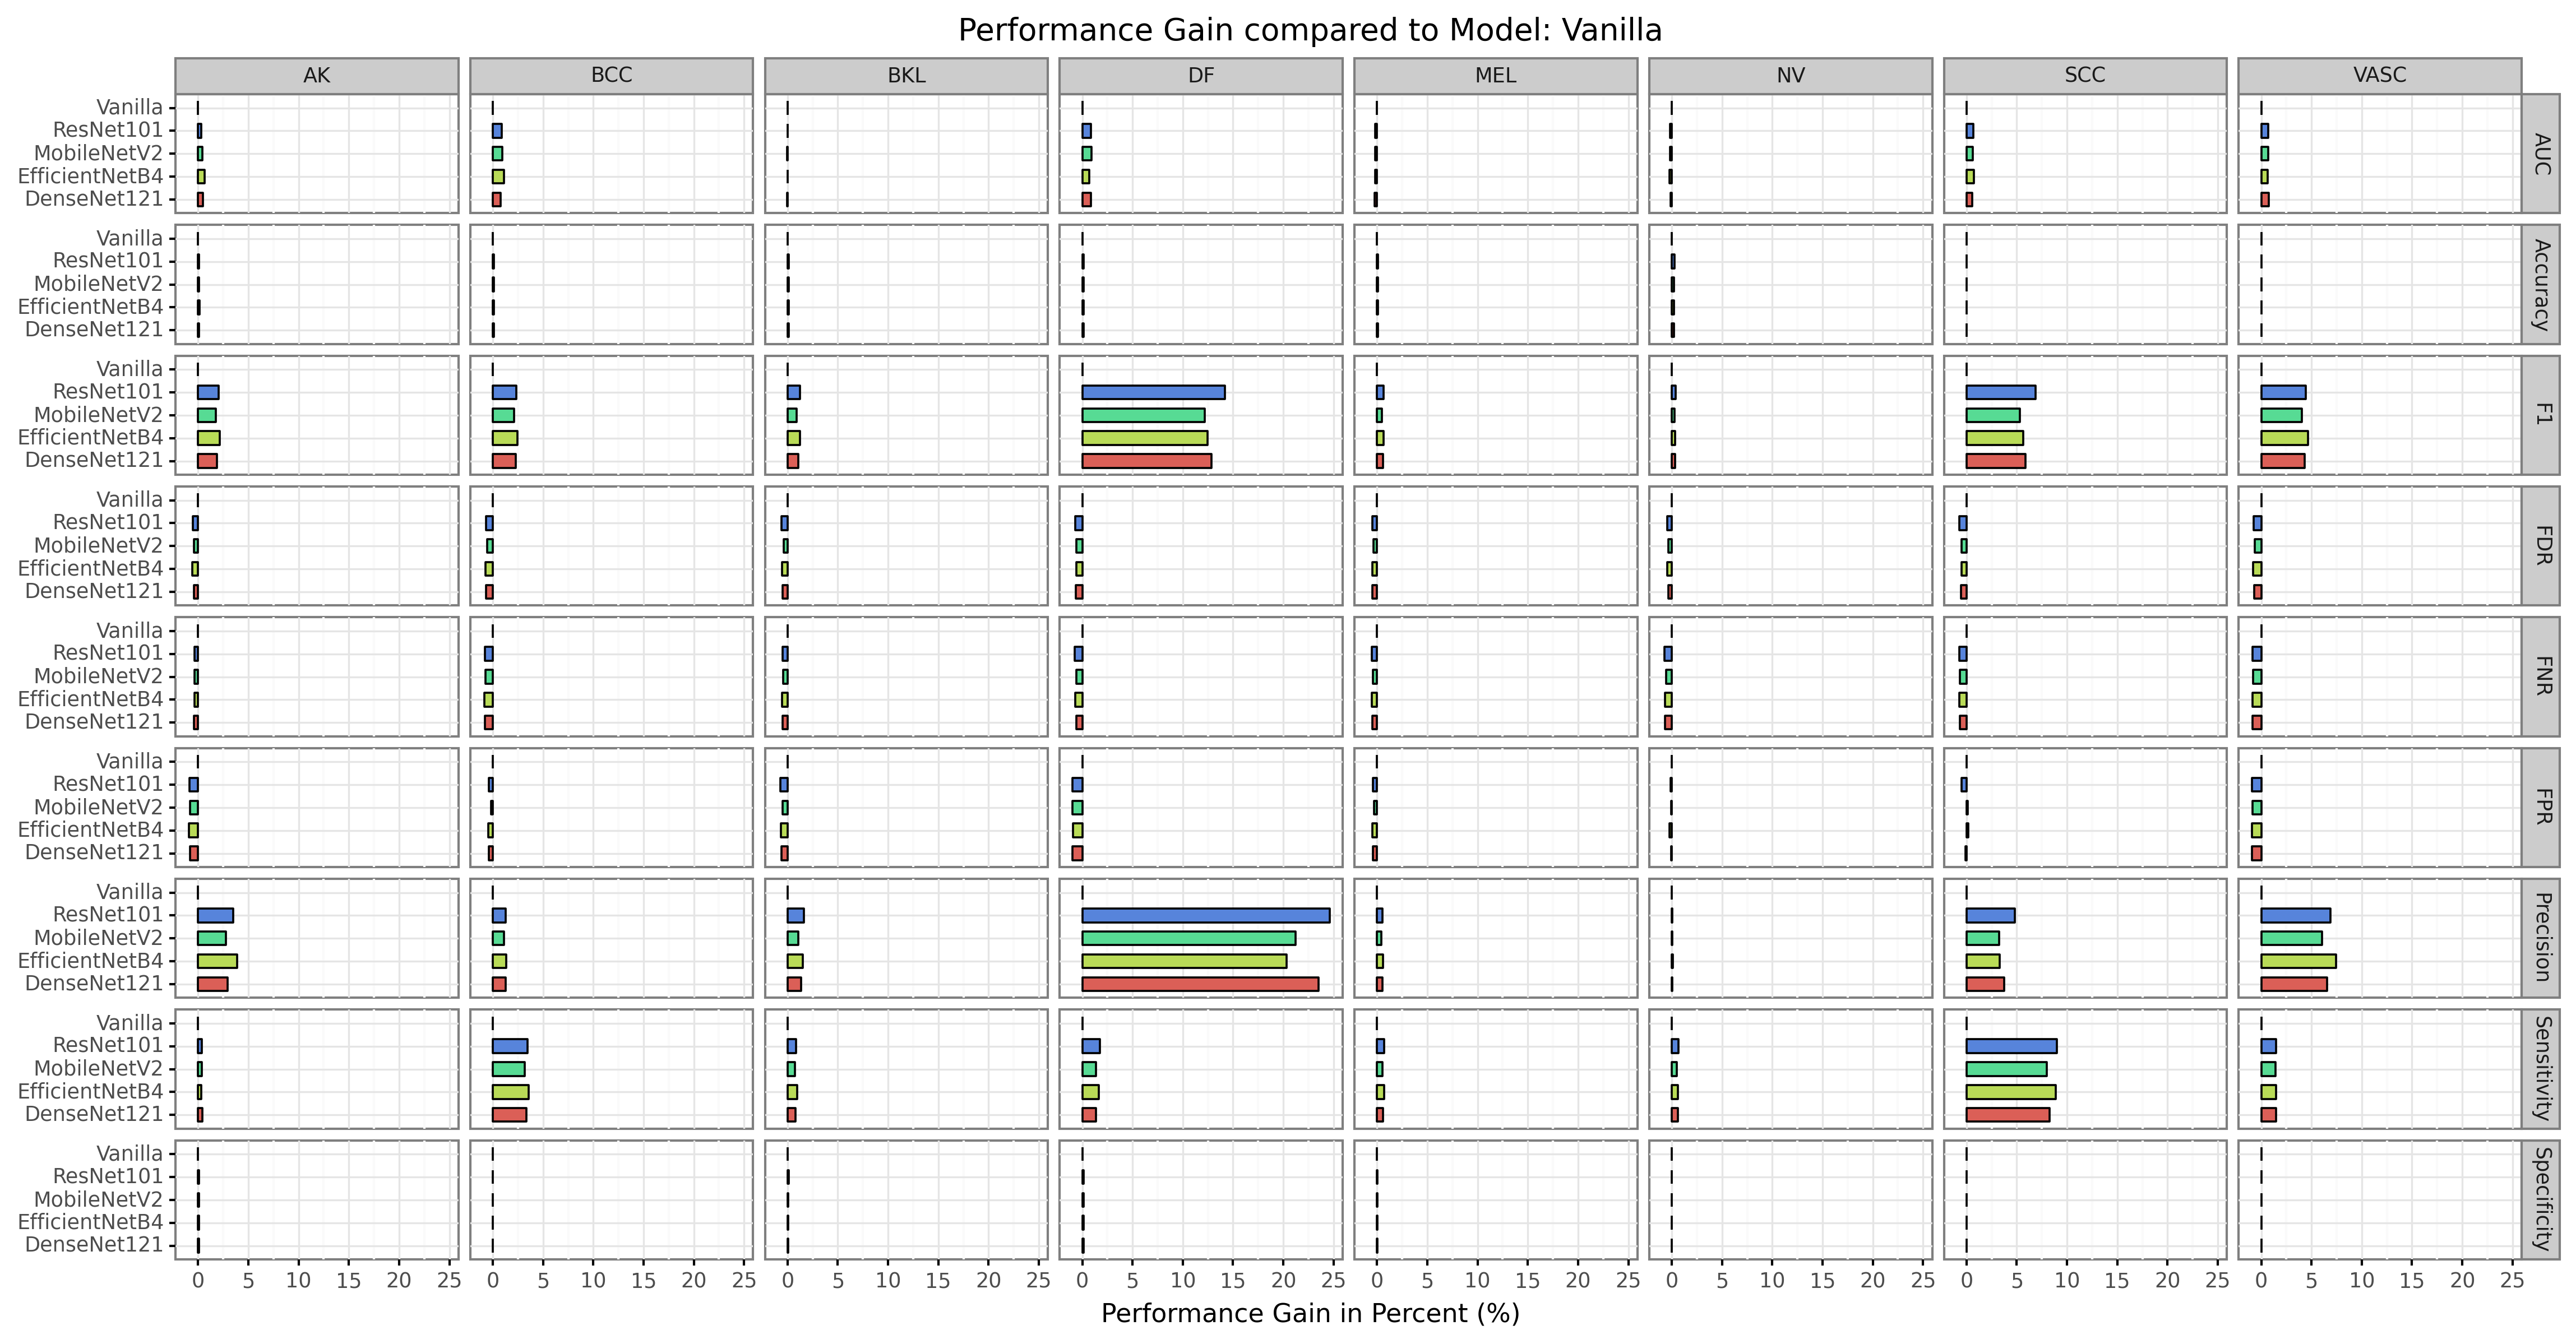
- "plot.comparison.gain.png"
Preview for Bar Plot
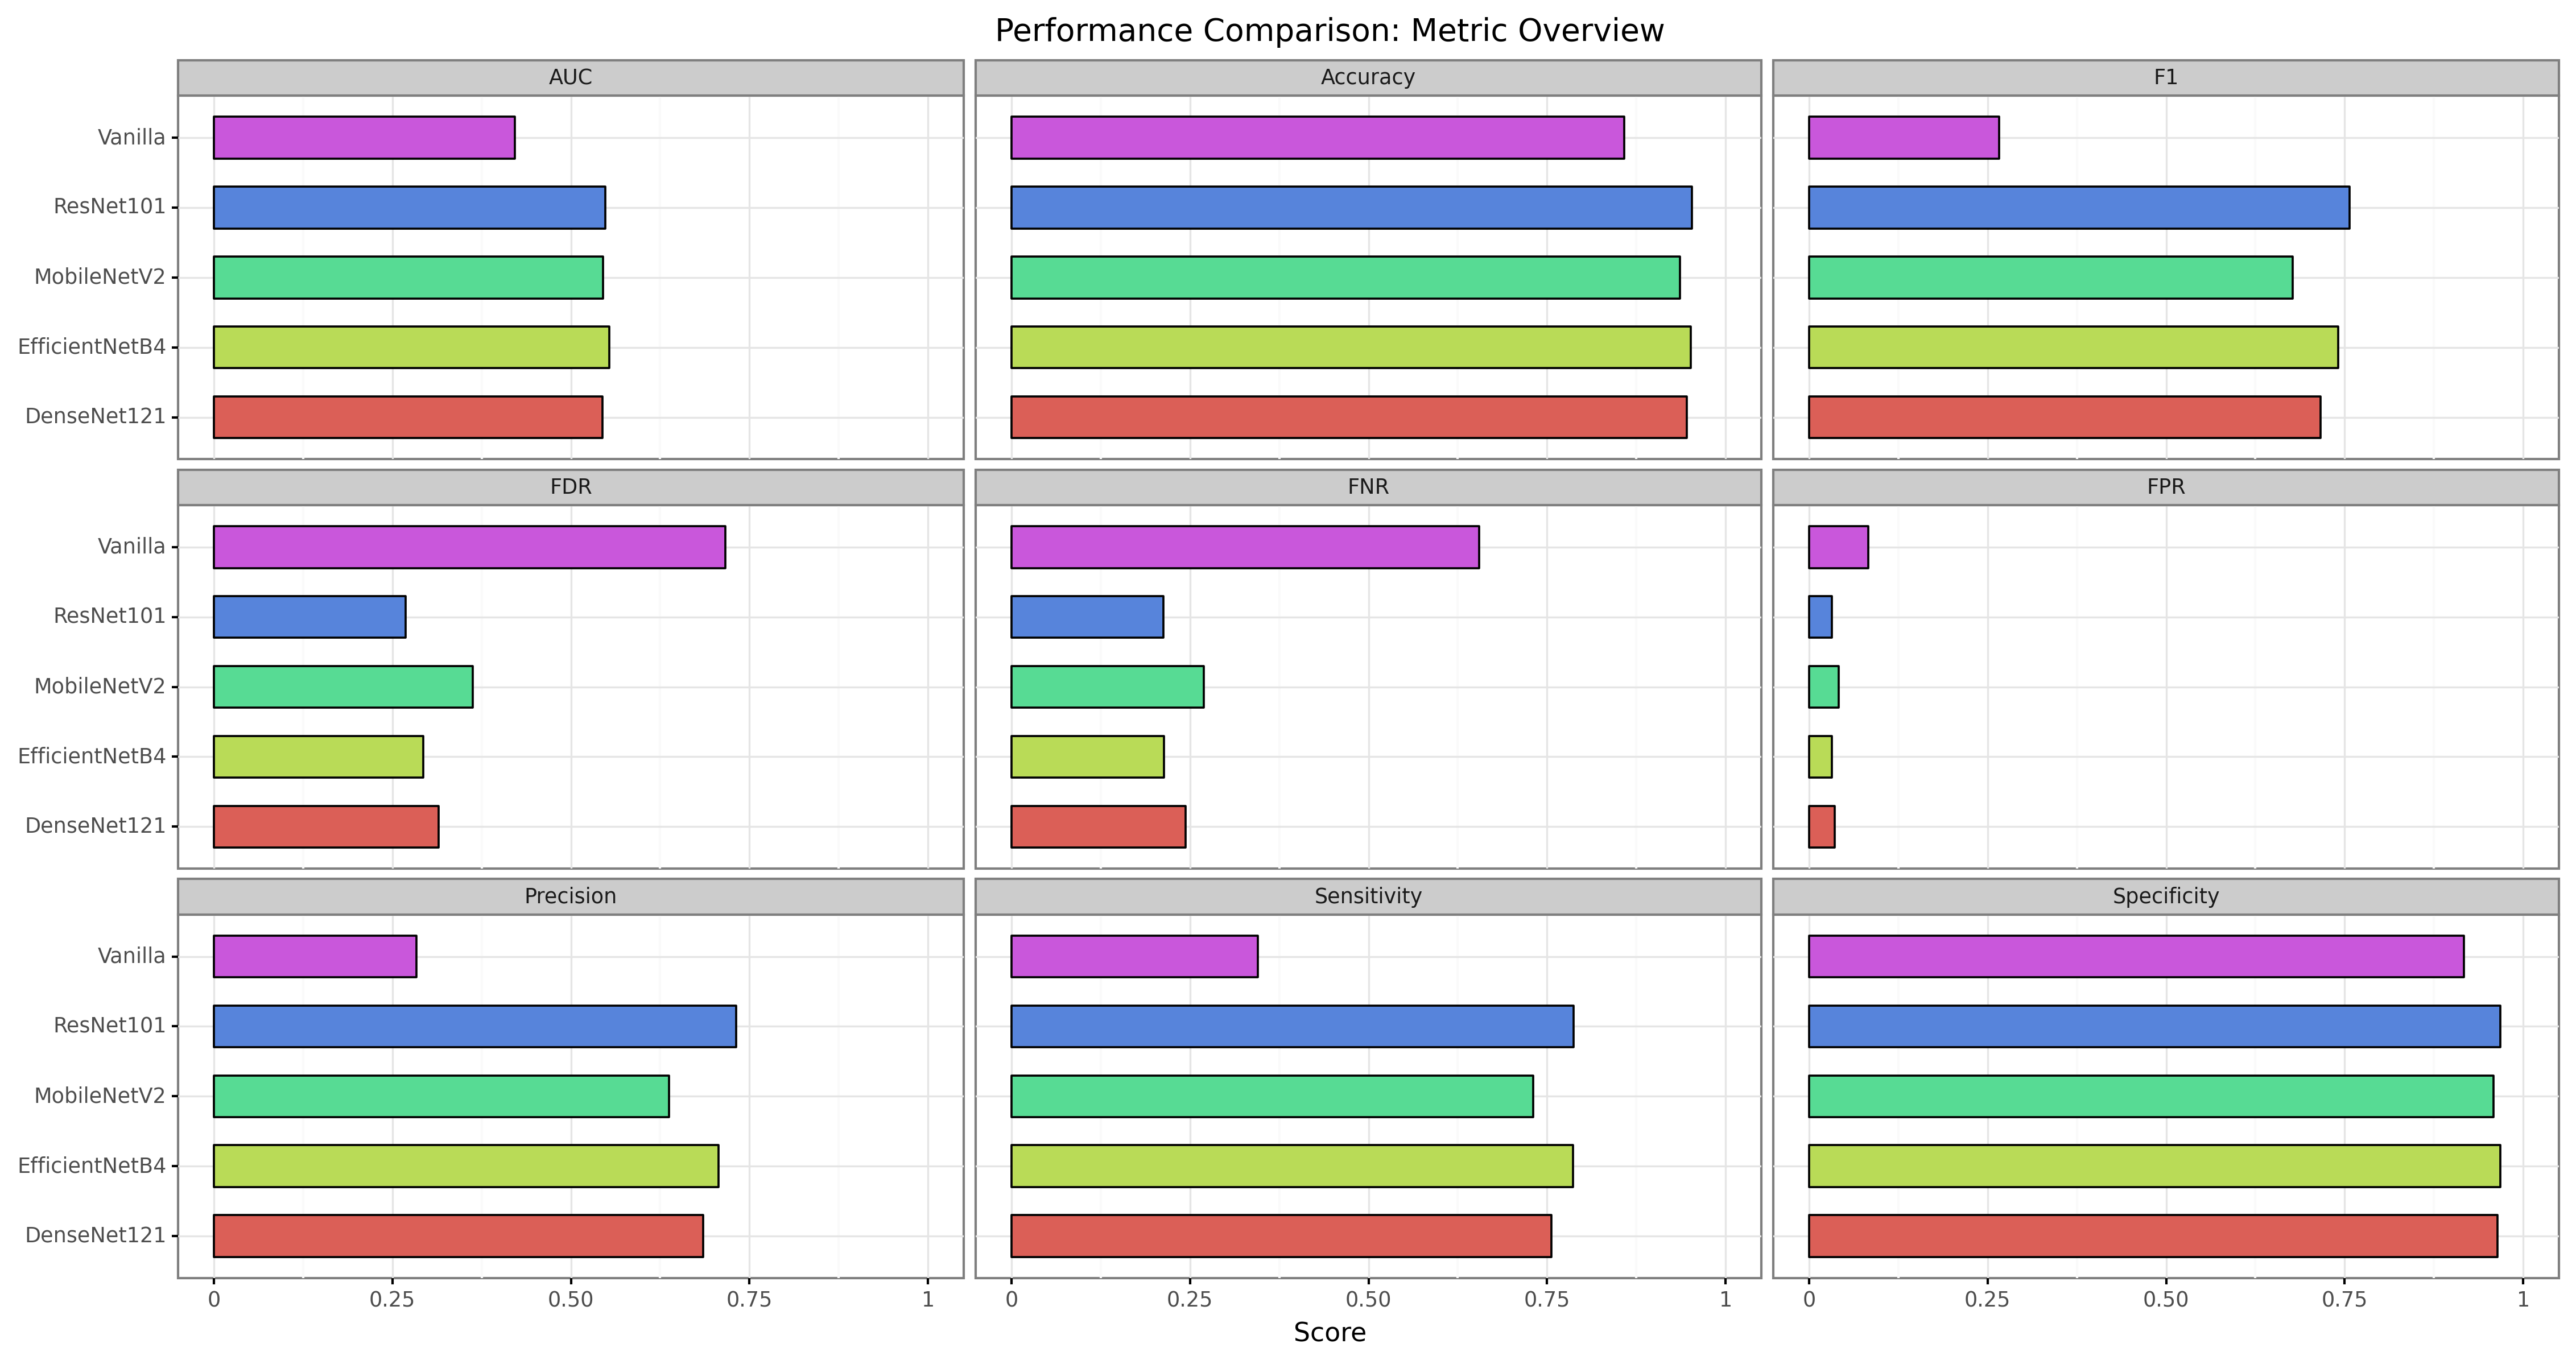
Predictions based on ISIC 2019 Challenge with macro-averaged class-wise metrics.
Parameters:
| Name | Type | Description | Default |
|---|---|---|---|
pred_list |
list of numpy.ndarray
|
A list of NumPy arrays containing predictions from multiple models formatted with shape (n_models, n_samples, n_labels). Provided by NeuralNetwork. |
required |
labels |
numpy.ndarray
|
Classification list with One-Hot Encoding. Provided by input_interface. |
required |
out_path |
str
|
Path to directory in which plotted figures are stored. |
required |
model_names |
list of str
|
List of names for corresponding models which are for visualization. If not provided ( |
None
|
class_names |
list of str
|
List of names for corresponding classes. Used for evaluation. Provided by
input_interface.
If not provided ( |
None
|
multi_label |
bool
|
Option, whether task is multi-label based (has impact on evaluation). |
False
|
metrics_threshold |
float
|
Only required if 'multi_label==True`. Threshold value if prediction is positive. Used in metric computation for CSV and bar plot. |
0.5
|
macro_average_classes |
bool
|
Option, whether classes should be macro-averaged in order to increase visualization overview. |
False
|
suffix |
str
|
Special suffix to add in the created figure filename. |
None
|
Returns:
| Name | Type | Description |
|---|---|---|
df_merged |
pandas.DataFrame
|
Dataframe containing the merged metrics of all models. |
df_gain |
pandas.DataFrame
|
Dataframe containing performance gain compared to first model. |
Source code in aucmedi/evaluation/comparison.py
33 34 35 36 37 38 39 40 41 42 43 44 45 46 47 48 49 50 51 52 53 54 55 56 57 58 59 60 61 62 63 64 65 66 67 68 69 70 71 72 73 74 75 76 77 78 79 80 81 82 83 84 85 86 87 88 89 90 91 92 93 94 95 96 97 98 99 100 101 102 103 104 105 106 107 108 109 110 111 112 113 114 115 116 117 118 119 120 121 122 123 124 125 126 127 128 129 130 131 132 133 134 135 136 137 138 139 140 141 142 143 144 145 146 147 148 149 150 151 152 153 154 155 156 157 158 159 160 161 162 163 164 165 | |