Skip to content

Performance

evaluate_performance(preds, labels, out_path, show=False, class_names=None, multi_label=False, metrics_threshold=0.5, suffix=None, store_csv=True, plot_barplot=True, plot_confusion_matrix=True, plot_roc_curve=True) ยค

Function for automatic performance evaluation based on model predictions.

Example
# Import libraries
from aucmedi import *
from aucmedi.evaluation import *

# Load data
ds = input_interface(interface="csv",                       # Interface type
                     path_imagedir="dataset/images/",
                     path_data="dataset/annotations.csv",
                     ohe=False, col_sample="ID", col_class="diagnosis")
(samples, class_ohe, nclasses, class_names, image_format) = ds

# Initialize model
model = NeuralNetwork(n_labels=8, channels=3, architecture="2D.ResNet50")

# Do some predictions
datagen_test = DataGenerator(samples, "dataset/images/", labels=None,
                             resize=model.meta_input, standardize_mode=model.meta_standardize)
preds = model.predict(datagen_test)

# Pass predictions to evaluation function
evaluate_performance(preds, class_ohe, out_path="./", class_names=class_names)

Created files in directory of out_path:

  • with store_csv: "metrics.performance.csv"
  • with 
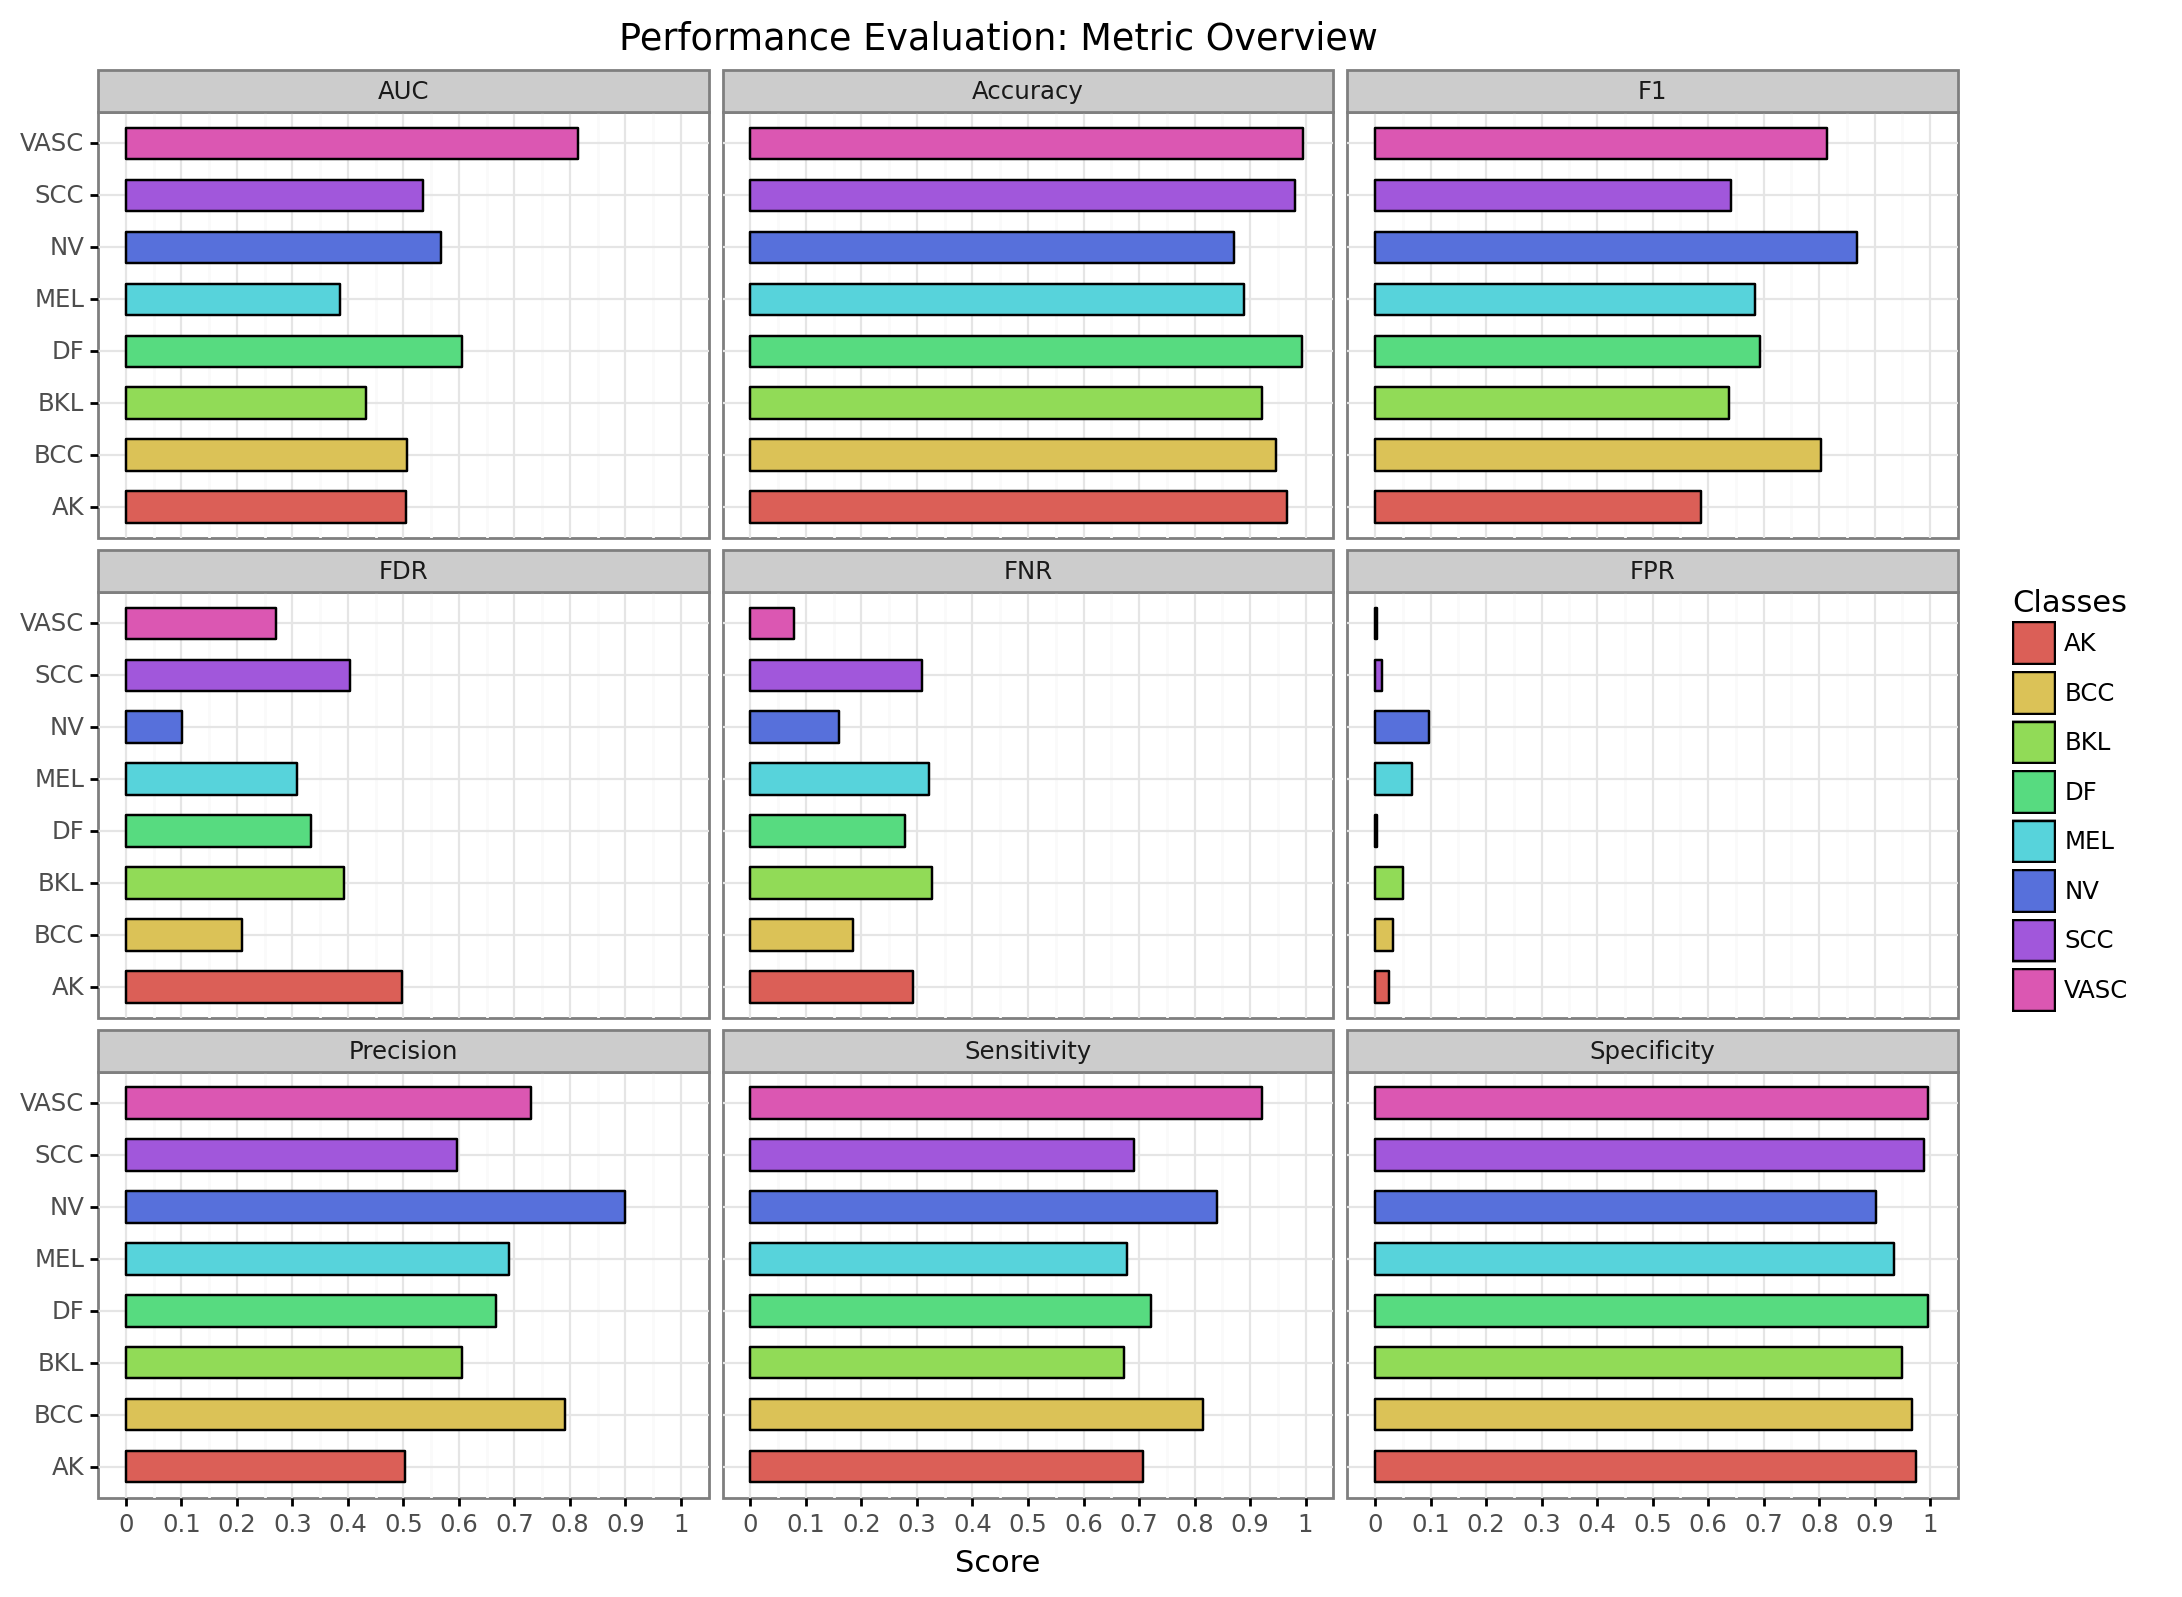
plot_barplot: "plot.performance.barplot.png"
  • with 
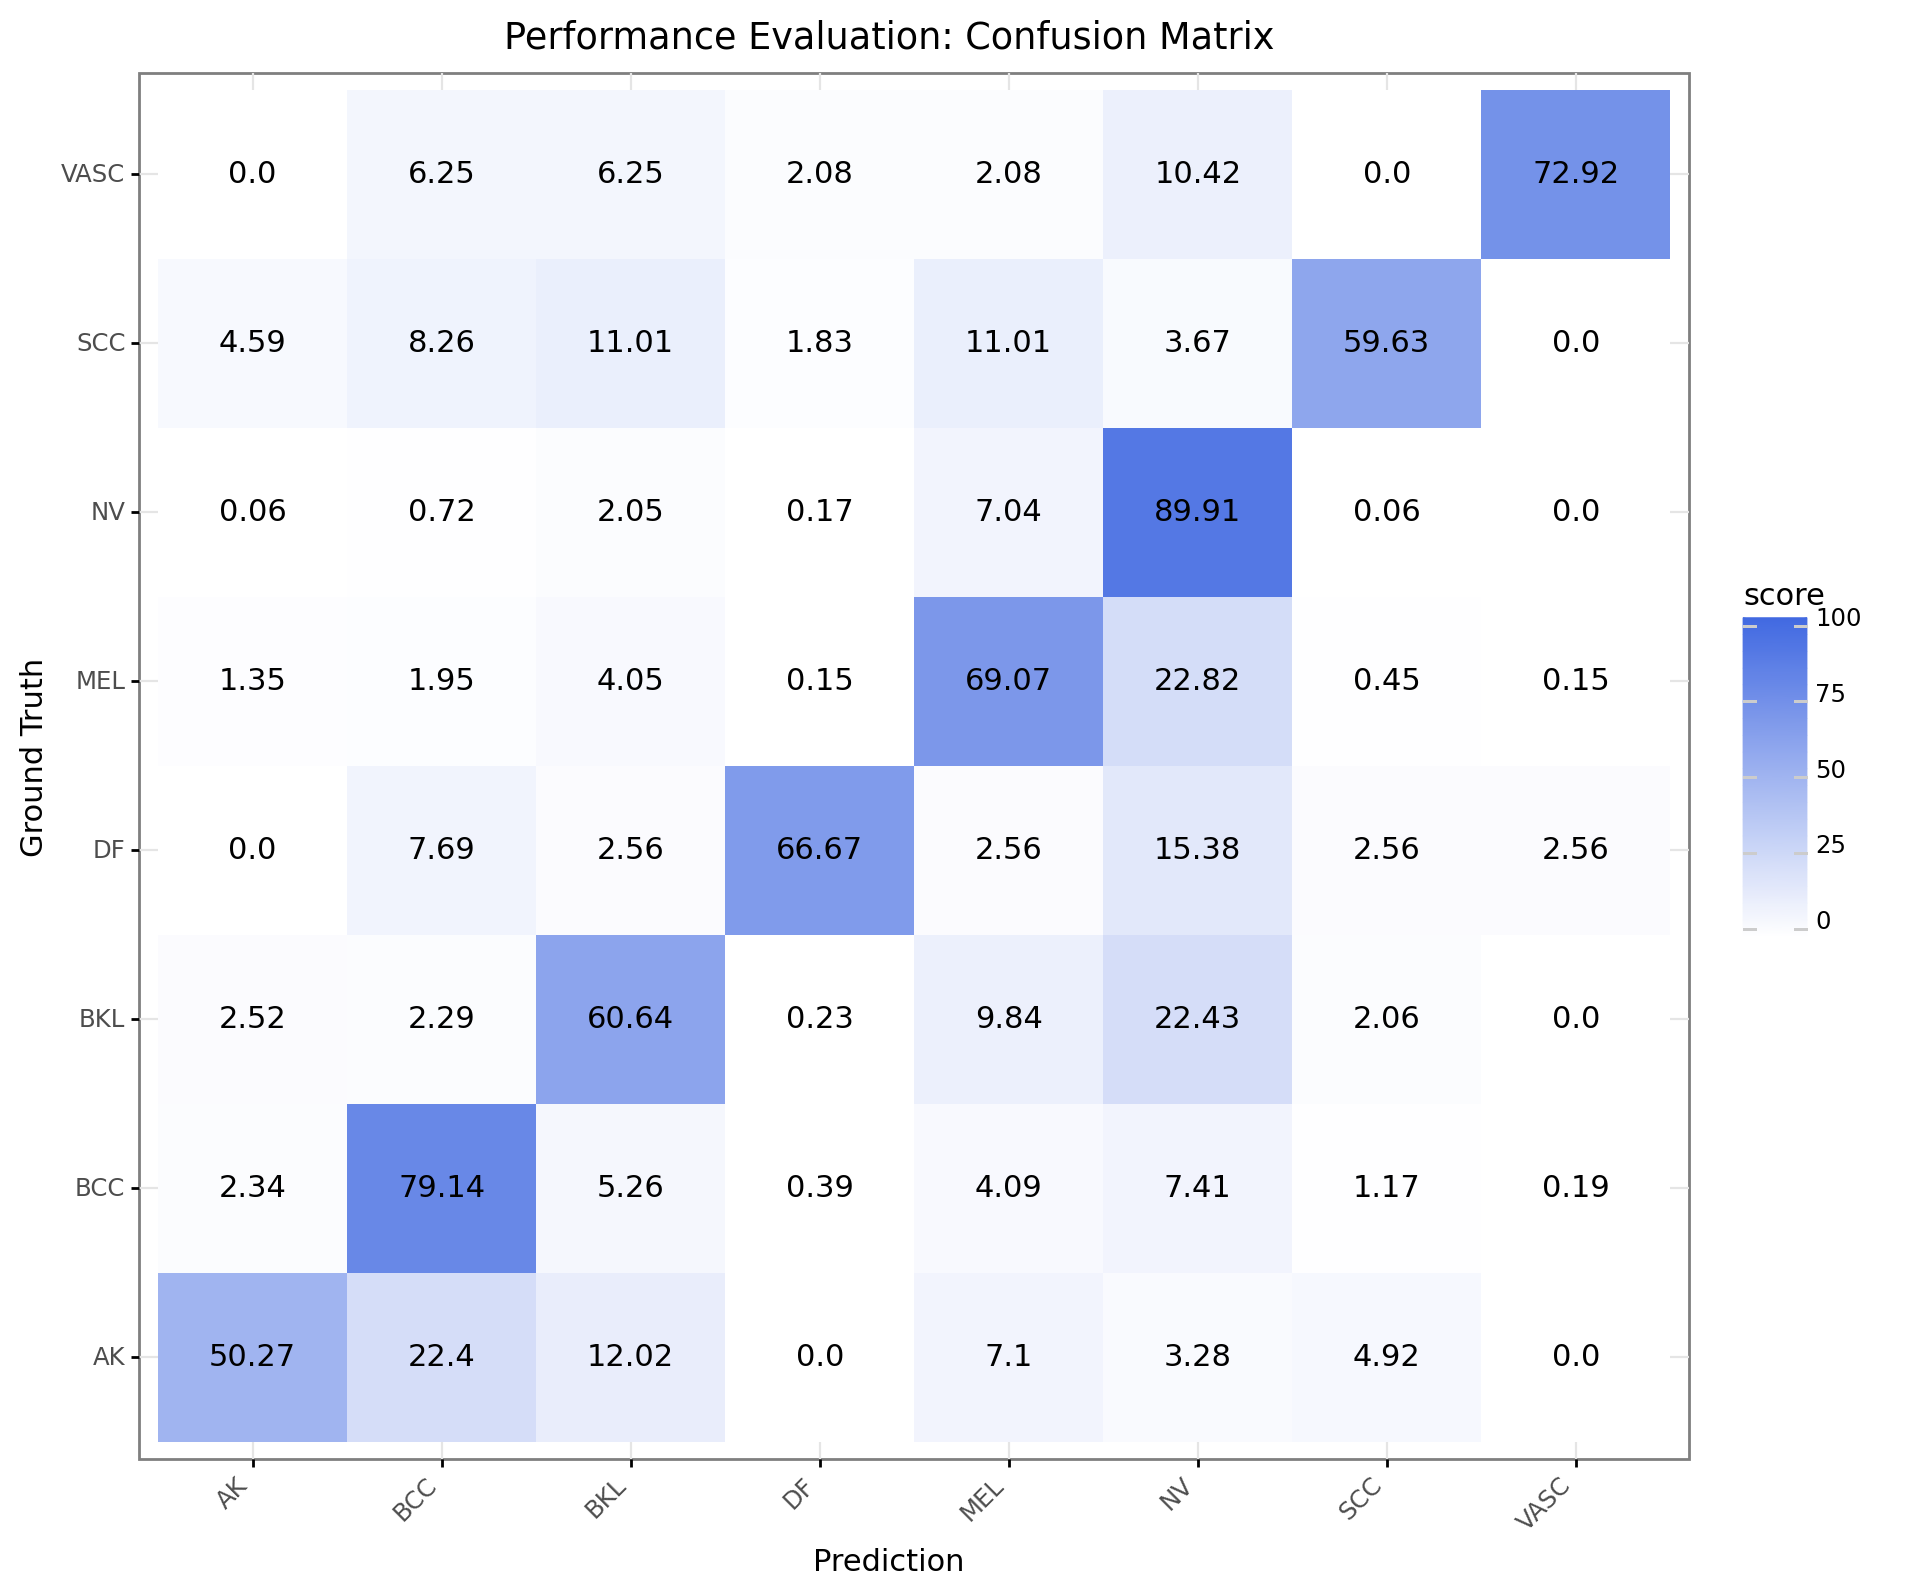
plot_confusion_matrix: "plot.performance.confusion_matrix.png"
  • with 
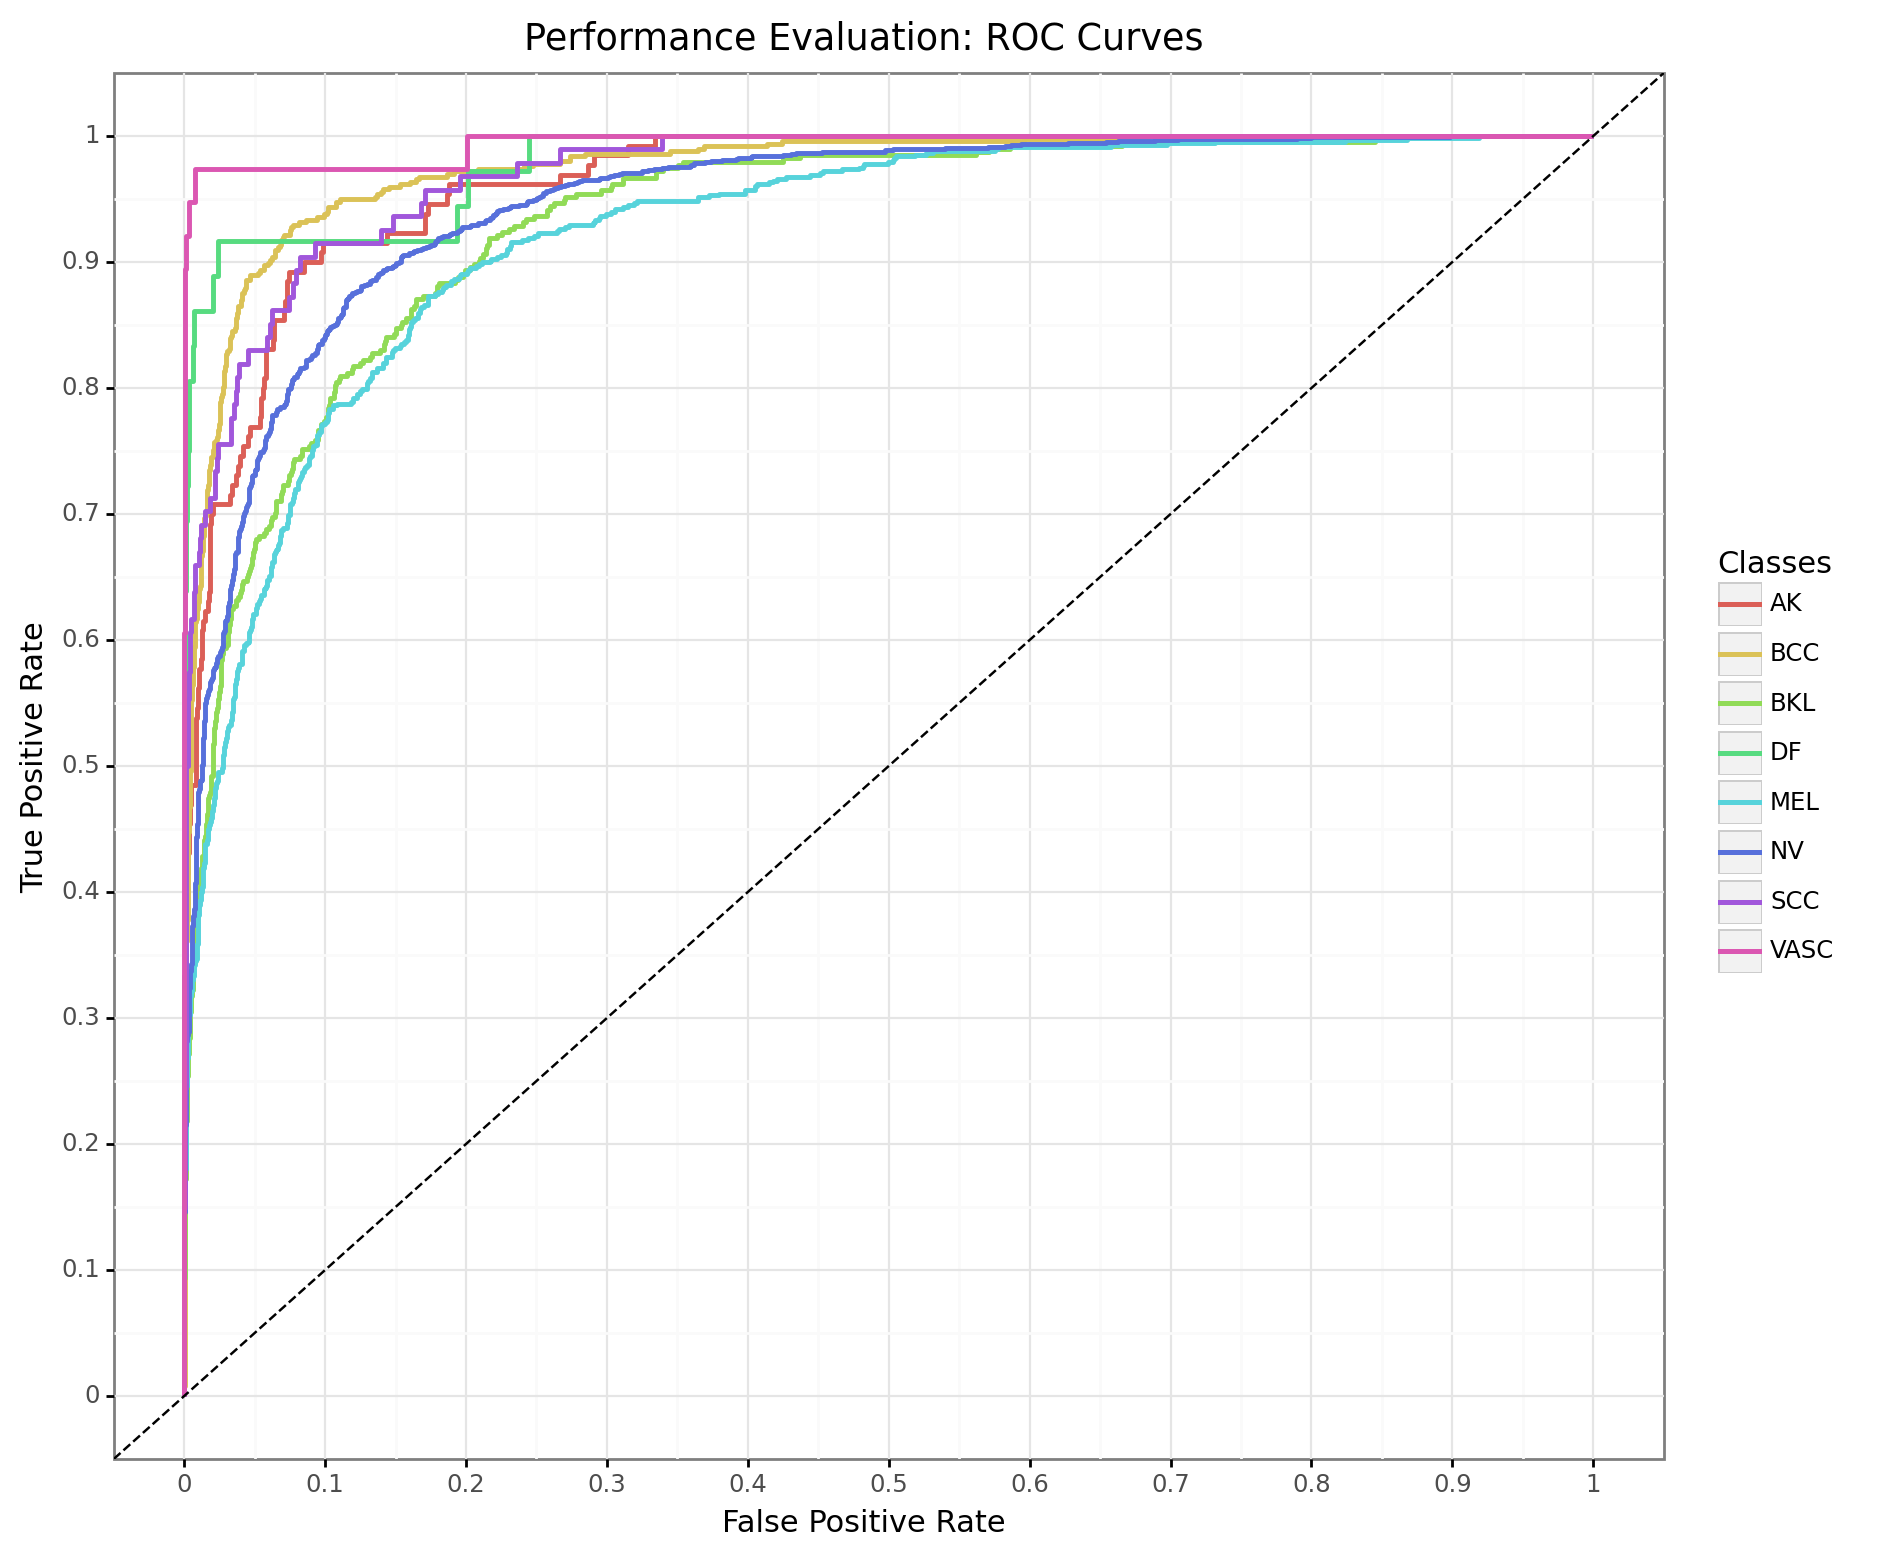
plot_roc_curve: "plot.performance.roc.png"
Preview for Bar Plot

Evaluation_Performance_Barplot

Predictions based on ISIC 2019 Challenge utilizing a DenseNet121.

Preview for Confusion Matrix

Evaluation_Performance_ConfusionMatrix

Predictions based on ISIC 2019 Challenge utilizing a DenseNet121.

Preview for ROC Curve

Evaluation_Performance_ROCcurve

Predictions based on ISIC 2019 Challenge utilizing a DenseNet121.

Parameters:

Name Type Description Default
preds numpy.ndarray

A NumPy array of predictions formatted with shape (n_samples, n_labels). Provided by NeuralNetwork.

required
labels numpy.ndarray

Classification list with One-Hot Encoding. Provided by input_interface.

required
out_path str

Path to directory in which plotted figures are stored.

required
show bool

Option, whether to also display the generated charts.

False
class_names list of str

List of names for corresponding classes. Used for evaluation. Provided by input_interface. If not provided (None provided), class indices will be used.

None
multi_label bool

Option, whether task is multi-label based (has impact on evaluation).

False
metrics_threshold float

Only required if 'multi_label==True`. Threshold value if prediction is positive. Used in metric computation for CSV and bar plot.

0.5
suffix str

Special suffix to add in the created figure filename.

None
store_csv bool

Option, whether to generate a CSV file containing various metrics.

True
plot_barplot bool

Option, whether to generate a bar plot of various metrics.

True
plot_confusion_matrix bool

Option, whether to generate a confusion matrix plot.

True
plot_roc_curve bool

Option, whether to generate a ROC curve plot.

True

Returns:

Name Type Description
metrics pandas.DataFrame

Dataframe containing all computed metrics (except ROC).

Source code in aucmedi/evaluation/performance.py
 33
 34
 35
 36
 37
 38
 39
 40
 41
 42
 43
 44
 45
 46
 47
 48
 49
 50
 51
 52
 53
 54
 55
 56
 57
 58
 59
 60
 61
 62
 63
 64
 65
 66
 67
 68
 69
 70
 71
 72
 73
 74
 75
 76
 77
 78
 79
 80
 81
 82
 83
 84
 85
 86
 87
 88
 89
 90
 91
 92
 93
 94
 95
 96
 97
 98
 99
100
101
102
103
104
105
106
107
108
109
110
111
112
113
114
115
116
117
118
119
120
121
122
123
124
125
126
127
128
129
130
131
132
133
134
135
136
137
138
139
140
141
142
143
144
145
146
147
148
149
150
151
152
153
154
155
def evaluate_performance(preds,
                         labels,
                         out_path,
                         show=False,
                         class_names=None,
                         multi_label=False,
                         metrics_threshold=0.5,
                         suffix=None,
                         store_csv=True,
                         plot_barplot=True,
                         plot_confusion_matrix=True,
                         plot_roc_curve=True):
    """ Function for automatic performance evaluation based on model predictions.

    ???+ example
        ```python
        # Import libraries
        from aucmedi import *
        from aucmedi.evaluation import *

        # Load data
        ds = input_interface(interface="csv",                       # Interface type
                             path_imagedir="dataset/images/",
                             path_data="dataset/annotations.csv",
                             ohe=False, col_sample="ID", col_class="diagnosis")
        (samples, class_ohe, nclasses, class_names, image_format) = ds

        # Initialize model
        model = NeuralNetwork(n_labels=8, channels=3, architecture="2D.ResNet50")

        # Do some predictions
        datagen_test = DataGenerator(samples, "dataset/images/", labels=None,
                                     resize=model.meta_input, standardize_mode=model.meta_standardize)
        preds = model.predict(datagen_test)

        # Pass predictions to evaluation function
        evaluate_performance(preds, class_ohe, out_path="./", class_names=class_names)
        ```

    Created files in directory of `out_path`:

    - with `store_csv`: "metrics.performance.csv"
    - with `plot_barplot`: "plot.performance.barplot.png"
    - with `plot_confusion_matrix`: "plot.performance.confusion_matrix.png"
    - with `plot_roc_curve`: "plot.performance.roc.png"

    ???+ info "Preview for Bar Plot"
        ![Evaluation_Performance_Barplot](../../images/evaluation.plot.performance.barplot.png)

        Predictions based on [ISIC 2019 Challenge](https://challenge.isic-archive.com/landing/2019/)
        utilizing a DenseNet121.

    ???+ info "Preview for Confusion Matrix"
        ![Evaluation_Performance_ConfusionMatrix](../../images/evaluation.plot.performance.confusion_matrix.png)

        Predictions based on [ISIC 2019 Challenge](https://challenge.isic-archive.com/landing/2019/)
        utilizing a DenseNet121.

    ???+ info "Preview for ROC Curve"
        ![Evaluation_Performance_ROCcurve](../../images/evaluation.plot.performance.roc.png)

        Predictions based on [ISIC 2019 Challenge](https://challenge.isic-archive.com/landing/2019/)
        utilizing a DenseNet121.

    Args:
        preds (numpy.ndarray):          A NumPy array of predictions formatted with shape (n_samples, n_labels). Provided by
                                        [NeuralNetwork][aucmedi.neural_network.model].
        labels (numpy.ndarray):         Classification list with One-Hot Encoding. Provided by
                                        [input_interface][aucmedi.data_processing.io_data.input_interface].
        out_path (str):                 Path to directory in which plotted figures are stored.
        show (bool):                    Option, whether to also display the generated charts.
        class_names (list of str):      List of names for corresponding classes. Used for evaluation. Provided by
                                        [input_interface][aucmedi.data_processing.io_data.input_interface].
                                        If not provided (`None` provided), class indices will be used.
        multi_label (bool):             Option, whether task is multi-label based (has impact on evaluation).
        metrics_threshold (float):      Only required if 'multi_label==True`. Threshold value if prediction is positive.
                                        Used in metric computation for CSV and bar plot.
        suffix (str):                   Special suffix to add in the created figure filename.
        store_csv (bool):               Option, whether to generate a CSV file containing various metrics.
        plot_barplot (bool):            Option, whether to generate a bar plot of various metrics.
        plot_confusion_matrix (bool):   Option, whether to generate a confusion matrix plot.
        plot_roc_curve (bool):          Option, whether to generate a ROC curve plot.

    Returns:
        metrics (pandas.DataFrame):     Dataframe containing all computed metrics (except ROC).
    """
    # Identify number of labels
    n_labels = labels.shape[-1]
    # Identify prediction threshold
    if multi_label : threshold = metrics_threshold
    else : threshold = None

    # Compute metrics
    metrics = compute_metrics(preds, labels, n_labels, threshold)
    cm = compute_confusion_matrix(preds, labels, n_labels)
    fpr_list, tpr_list = compute_roc(preds, labels, n_labels)

    # Rename columns in metrics dataframe
    class_mapping = {}
    if class_names is not None:
        for c in range(len(class_names)):
            class_mapping[c] = class_names[c]
        metrics["class"].replace(class_mapping, inplace=True)
    if class_names is None : metrics["class"] = pd.Categorical(metrics["class"])

    # Store metrics to CSV
    if store_csv:
        evalby_csv(metrics, out_path, class_names, suffix=suffix)

    # Generate bar plot
    if plot_barplot:
        evalby_barplot(metrics, out_path, class_names, show=show, suffix=suffix)

    # Generate confusion matrix plot
    if plot_confusion_matrix and not multi_label:
        evalby_confusion_matrix(cm, out_path, class_names, show=show, suffix=suffix)

    # Generate ROC curve
    if plot_roc_curve:
        evalby_rocplot(fpr_list, tpr_list, out_path, class_names, show=show, suffix=suffix)

    # Return metrics
    return metrics