Fitting
evaluate_fitting(train_history, out_path, monitor=['loss'], prefix_split='.', suffix=None, show=False)
¤
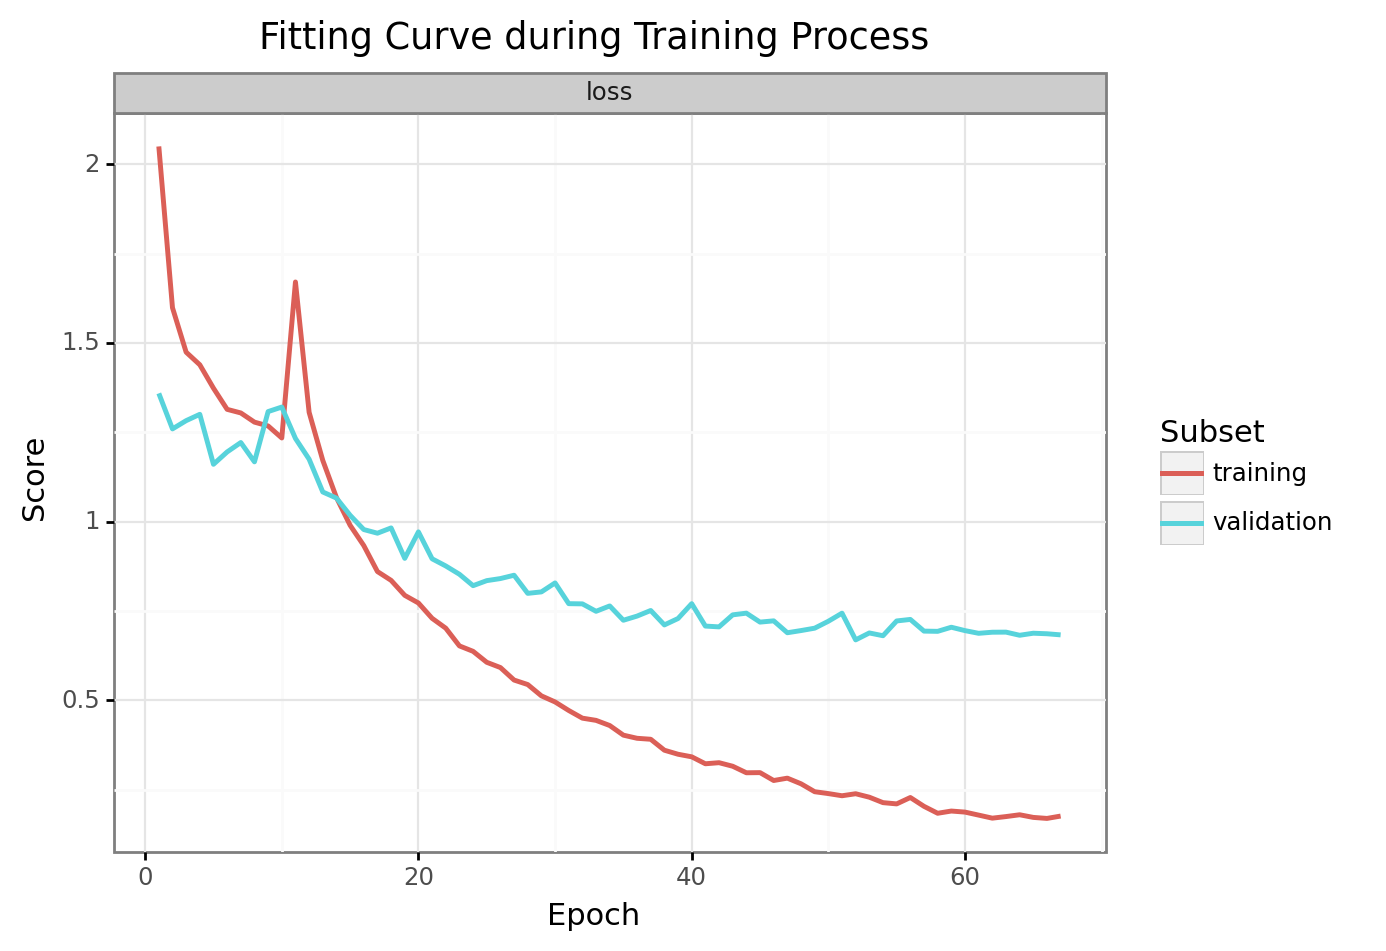
Function for automatic plot generation providing a training history dictionary.
Preview
Created filename in directory of out_path:
- without suffix "plot.fitting_course.png"
- with suffix "plot.fitting_course.SUFFIX.png"
Example
# Initialize and train a model
model = NeuralNetwork(n_labels=8, channels=3, architecture="2D.ResNet50")
history = model.train(datagen_train, datagen_validation, epochs=100)

# Pass history dict to evaluation function
evaluate_fitting(history, out_path="./")

# Figure will be created at: "./plot.fitting_course.png"
Parameters:
| Name | Type | Description | Default |
|---|---|---|---|
train_history |
dict
|
A history dictionary from a Keras history object which contains several logs. |
required |
out_path |
str
|
Path to directory in which plotted figure is stored. |
required |
monitor |
list of str
|
List of metrics which should be visualized in the fitting plot. |
['loss']
|
prefix_split |
str
|
Split prefix for keys in the history dictionary. Used for Bagging and Stacking. |
'.'
|
suffix |
str
|
Special suffix to add in the created figure filename. |
None
|
show |
bool
|
Option, whether to also display the generated chart. |
False
|
Source code in aucmedi/evaluation/fitting.py
31 32 33 34 35 36 37 38 39 40 41 42 43 44 45 46 47 48 49 50 51 52 53 54 55 56 57 58 59 60 61 62 63 64 65 66 67 68 69 70 71 72 73 74 75 76 77 78 79 80 81 82 83 84 85 86 87 88 89 90 91 92 93 94 95 96 97 98 99 100 101 102 103 104 105 106 107 108 109 110 111 112 113 114 115 116 117 118 119 120 121 122 123 124 125 126 127 128 129 130 131 132 133 134 135 136 137 138 139 140 141 142 143 144 145 146 147 148 149 150 151 152 153 154 155 156 157 158 159 160 161 162 163 164 165 166 | |